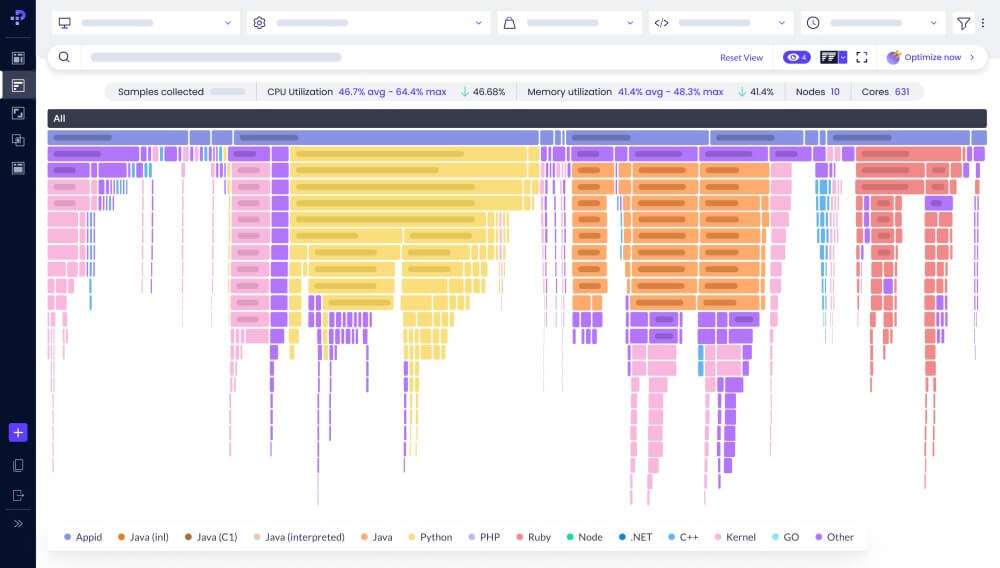

Continuous Profiler is an open-source tool created by Intel Granulate that integrates multiple profilers into a single flame graph display. This unified view would provide an autonomous and continuous method for identifying runtime inefficiencies for developers, performance engineers, and DevOps.
“Continuous Profiler has been at the heart of what we’ve been doing at Intel Granulate,” said Asaf Ezra, General Manager at Intel Granulate. “By helping developers identify bottlenecks in the code, businesses can optimize their applications more easily and effectively.”
Visualized View
In every testing or production environment, one of the typical tasks for performance analysis is figuring out why central processing units (CPUs) are busy. The hottest code paths are shown in a flame graph by Continuous Profiler.
“This visualized view makes it immediately obvious where CPU is consumed so you can find cost savings, eliminate bottlenecks, improve throughput, and reduce latency and performance regressions,” said Brendan Gregg, Intel Fellow. “In today’s complex environment, however, flame graphs can unearth so many performance wins that it becomes laborious to apply them all. Intel Granulate automates this task, allowing companies to realize these performance wins now and in the future as Intel develops more optimizations.”
– story continues below the graphic –


Open Source Ecosystem
How it works? A single, cohesive representation of the tasks that a CPU is doing is generated by the Continuous Profiler, a development of gProfiler that integrates many sample profilers. Flame graphs that are simple to traverse identify performance regressions, including deadlocks and trash collection, to facilitate deployments.
Continuous Profiler would be one of the few tools that lets DevOps filter services by hostname, container name, or Kubernetes deployment object. All it takes is choosing the resolution level on the page. Without the need to launch a profiler for every item, these built-in Kubernetes filters profile down from the deployment to pod level. Teams are able to examine how various deployments, pods, nodes, and hosts behave in various areas and code thanks to this.
Within minutes, the profiler can be deployed cluster-wide and support a variety of programming languages without needing code modifications. It is also compatible with Intel Granulate‘s continuous optimization services. The Constant Profiler has a SOC2 certification.
Continuous Profiler’s straightforward user interface (UI) and seamless integration would enable it to identify runtime bottlenecks, optimize application performance for better user experiences, and make adjustments to satisfy specific developer requirements. Intel says it will continue to improve the tool and assist developers in creating applications that would be more robust, quicker, and more affordable in collaboration with open source contributors and the larger ecosystem.


